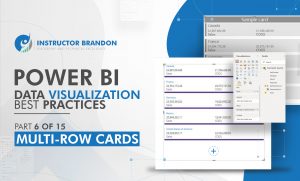
Power BI Data Visualization Best Practices Part 6 of 15: Multi-Row Cards
When it comes to understanding data to its fullest, there is an absolute need to rely on powerful tools for […]
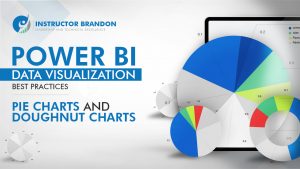
Power BI Data Visualization Best Practices Part 5 of 15: Pie Charts and Doughnut Charts
Moving on in our Power BI Data Visualization Series, it is now time to cover two other types of charts […]
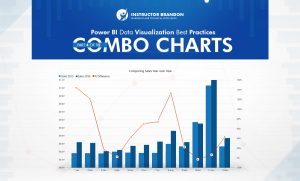
Power BI Data Visualization Best Practices Part 4 of 15: Combo Charts
The concept of Business Intelligence is not new in our world but has gained more strength within the business market […]
Remove a Legal Entity in Microsoft Dynamics 365
Microsoft Dynamics 365 is a platform that offers a wide variety of solutions that help drive each business according to […]

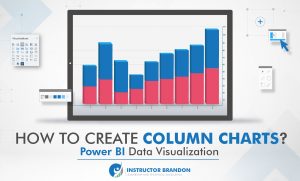
Power BI Data Visualization Best Practices Part 3 of 15: Column Charts
The world is now digitalizing. Since businesses are opting for a more ‘digital approach’ in recent years, organizations have now […]
Dynamics 365 Animated Supply Chain Videos Explained: Part 4 of 50: Inventory Cycle Counting
Dynamics 365 Inventory Cycle Counting Supply Chain Video Part 4 And the fun continues. In this video, we cover Inventory […]

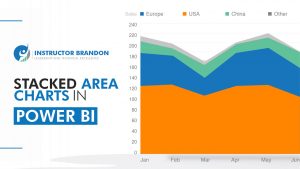
Power BI Data Visualization Best Practices Part 2 of 15: Stacked Area Charts
The Digital World & Business Intelligence In the midst of a digitally competitive era, making well-informed decisions has become the […]
Quick Tip: Getting Chrome to work in the new Dynamics 365 F&S OneBox Machine (10.X.X.XX)
Hello everyone, this is just a quick tip. So, I just unwrapped the Dynamics 365 F&S 10.0.0.13 virtual machines and […]
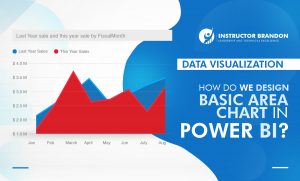
Power BI Data Visualization Best Practices-Part 1 of 15: Basic Area Charts
Once more, Microsoft has revolutionized new technology by offering tools such as Microsoft Power BI and the different visualizations it […]
Dynamics 365 Animated Supply Chain Videos Explained Part 3 of 50 – Inventory Consignment
Dynamics 365 Inventory Consignment Supply Chain Video Part 3 In our continual mission to make learning ERP concepts fun in […]