Consulting, Microsoft Dynamics AX
The Art of Advanced Troubleshooting and Debugging for Production Scenarios in Dynamics AX
 13240
13240 
Jul
Today, we are going to do something that I haven’t seen documented on the net – the art of debugging a Production environment in Dynamics AX. One of my secrets to fixing so many implementations is to understand that not every problem is a by the book, ideal fairy-tale scenario. Sometimes errors occurs in Production that just don’t occur anywhere else. The official documentation says that you should never debug Production with Visual Studio. I agree. However, many people wrongfully take this to mean that you should never debug Production period – Wrong!!! When you need to go heavy duty on Production, there is one tool that has been THE tool for years – WINDBG.
Again, you should always try to reproduce issues in your Test environments, and the majority of the time you will be able to do so. But sometimes, you need the tools to solve the heavy duty problems without waiting weeks or months for them to be solved.
When debugging real-live Production data, nothing works like WINDBG. Visual Studio, on the other hand, is the tool of choice when debugging Development environments. Let’s see how to debug a Production environment here.
First, Start up the dynamics AX Client

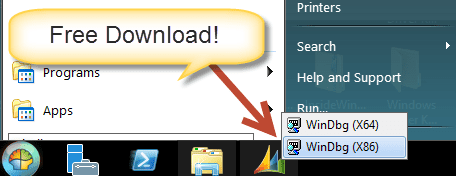
Second, startup WinDBG
WinDbg is free and comes as part of the Microsoft Software Development Kit. Make sure that you start the x86 version which is the version that matches the Dynamics AX client in this case. If you are debugging the server, you want to look at the 64 Bit version.
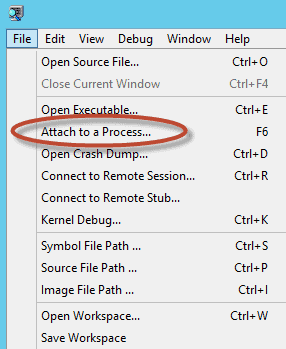
Third, click File à Attach to Process
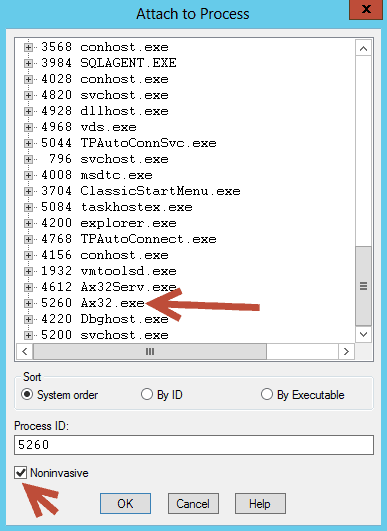
Fourth, for the Dynamics AX Client, choose the Process ID that has AX32.exe and click OK.
The Process ID differs depending on when you run it and what machine it is ran from. Notice, here that you must choose the non-invasive checkbox. This says that the debugger will play nice and not disrupt any of Dynamics AX normal processes. Dynamics AX has a built in debugger that does stuff like “stop the server” which may not be an option in production. Think of using WinDbg as a glorified Dynamics AX peepshow which allows for you to see what is happening when those errors are generating, but without interrupting the AX operations.
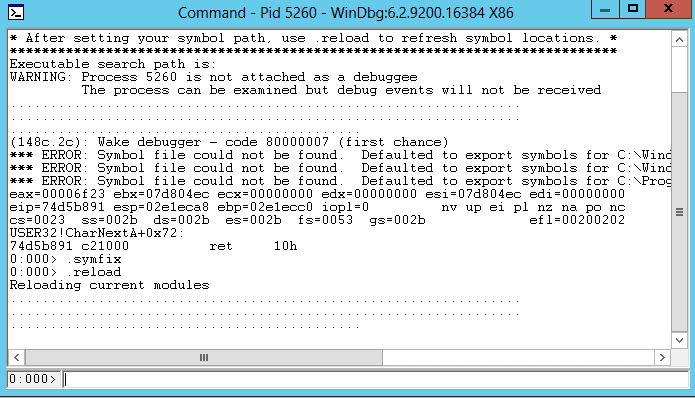
Fifth, load the symbols with the .symfix and .reload command
Don’t get confused by “fancy” big words like symbols. All that symbols do is allow the debugger to output computer language into a language that you can see and on the screen. Microsoft maintains a “Symbols” server which has the super translators for every single application that they make. You can also get them directly for a file with .pdb which is included with your AX installation.
Here is the error looking for symbols.
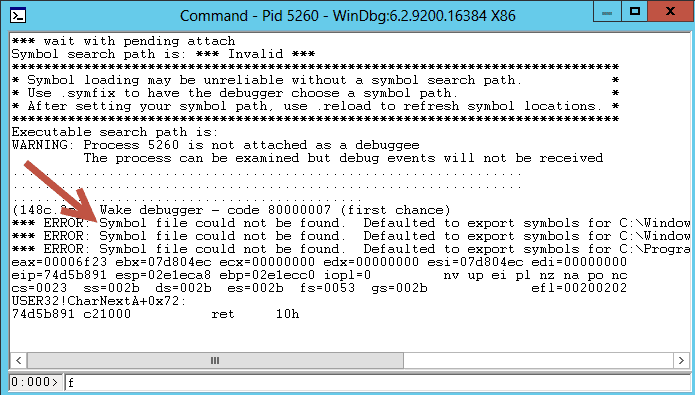
Now, let’s load the symbols by typing the .symfix and the .reload command.
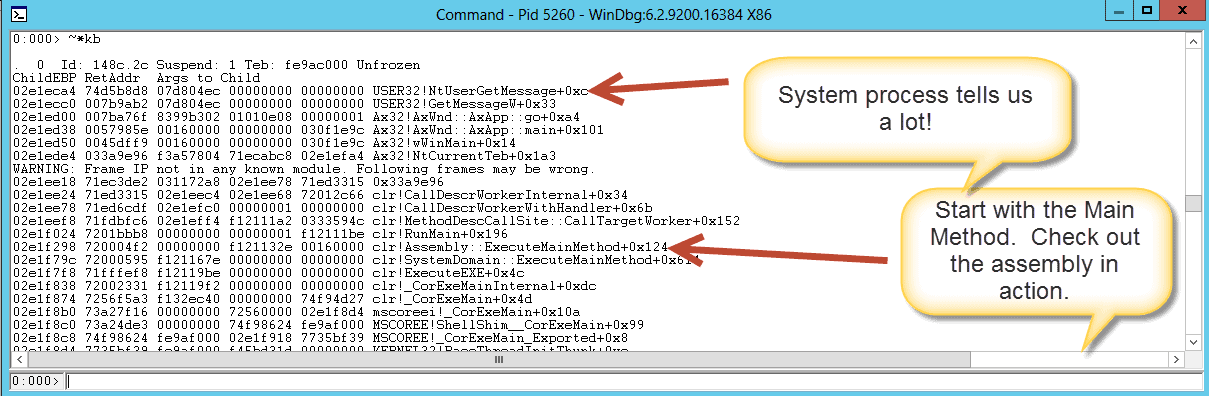
6th, now, you are in business. You can type the command ~*kb
This is extremely powerful. You can see the Programming sequence that led to whatever big bad error that you are getting (aka call stack), plus you can see the assembly that was in use or not in use.
And Pow.. Now, if you read the documentation, you will see that this can also be used to generate a dump file – a file that can be used for later analysis which shows what AX was doing (usually at the time that it crashed), but this will give you the ability to see what is going on without shutting down the server. I wrote this because I had not seen it documented anywhere else on how to run a real, live debug of Production, but it is an enormously important skill. Hope it helps all of you troubleshooting specialist out there who keep AX running and allow business operation users to sleep at night.
P.S. I’ve been late on emails lately, and I feel horrible about it. If I respond slowly, it is only because I’m knee-deep in some aspect of a Dynamics AX implementation and not ignoring anyone.

