Consulting, Microsoft Dynamics AX
Troubleshooting Dynamics AX 2012 Performance
 15567
15567 
Jan
I promised to do a series on this while answering questions on a forum. Troubleshooting Dynamics AX Performance can seem daunting at first, but it does not have to be so.
There are two challenges to troubleshooting a Dynamics implementation for Performance:
1. You need to figure out the underlying load on the SQL system (as you will see this is where your SQL skills will prove quite advantageous)
2. You need to find the application behavior that generates that overload --> in other words, you need to know what the database was doing.
Diagnostics needs to be done in steps because you need to first examine the load on SQL Server.
The first thing that we must do is utilize the generous logging capabilities of Dynamics AX. Dynamics AX is like a performance troubleshooting buffet – full of so much information. I’m amazed at the number of people who troubleshoot Dynamics without knowing how to use these tools. They are great and will save you a ton of time while making your life easier.
Step 1: on the Server(or servers) that is running Dynamics AX, you need to setup a trace through Dynamics.
- To do that, go to File -->ToolsàOptions
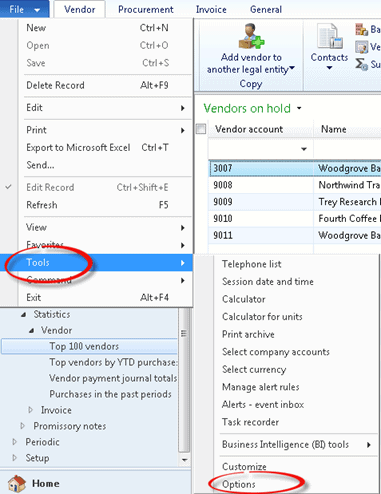
- Enable SQL Trace, by going to the SQL option of the dialog box and checking them all. Note: only do this if you are not sure of the Performance issue. Also, don’t do it on all of your AOS servers. Only do this on one AOS server at a time. NOTE: do not leave all of these options checked infinitely – it will result in additional performance load on the server. This is strictly for finding the performance bottleneck and then you change the settings back to whatever they were (if the server ran acceptably at these settings).
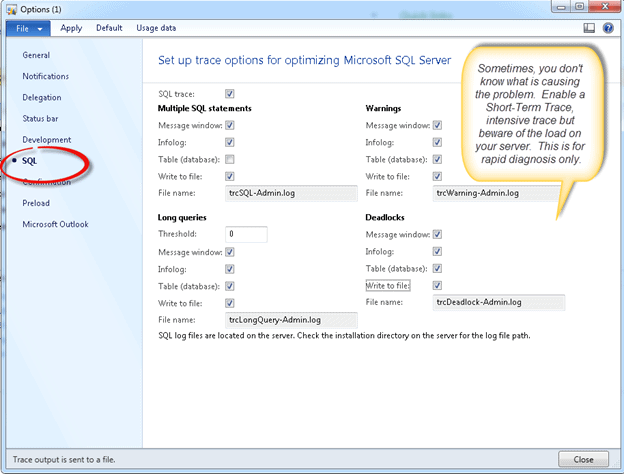
****You’ve just enabled multiple options. You will not need to enable all of these in real life. For example, having the infolog checked is great for troubleshooting and retracing steps, but it can irritate users if you turn this on because they keep getting popups — helpful for us though.. Using a table is great to get SSRS reports and long term maintenance. Some of the other file based logs are great for small operations that do not need to be written to an IO disk**** But enabling them will show you what they do.
Now, once that is done, we are finished with Part 1. In Part 2, we’ll understand why you must also set up usage data. In Part 3, we’ll cover how to setup a trace appropriately for long-term debugging and performance analysis. In Part 4, we’ll learn some useful Performance Monitor counters for troubleshooting Dynamics AX Performance. In Part 5, we’ll talk about how to read the logs and the trace files. In Part 6, we’ll see how to diagnose MorphX issues by looking at SQL queries.
Note: this series will take me about two months to finish due to a hectic schedule coupled with the fact that I’m finishing up the SSRS series on YouTube. If you need to start troubleshooting performance now, look at the slow SQL queries, bring up query plans, and begin diagnosing the issues. This will tell you which MorphX queries need to be adjusted and how. In the meantime, please use this link as a guide until I can finish the rest of my series. This will give you a good starting point:
http://technet.microsoft.com/en-us/library/aa570100(v=ax.50).aspx

