Microsoft Power BI Series
Power BI Data Visualization Best Practices Part 7 of 15: Single Number Cards
 6519
6519 
Jan
In today’s world of digital excellence, Microsoft Power BI is a tool that helps companies stay ahead in the current tech race.
Data Visualization helps companies in getting, organizing, and sharing valuable data within their organization.
Businesses these days pay huge amounts of money to be able to use their data effectively and quickly. Then, for this reason, a data visualization tool such as Power BI is a must-have. It focuses on making information easy to understand while using it in dynamic graphs. We can make helpful business reports with data visualization tools using simpler methods.
Organizations, however, use these business reports in many ways.
Firstly, these reports are great for backup when you are reaching conclusions. Also, these reports help with taking ‘safer’ decisions for your business. This, while taking into consideration the results you have through your data visuals. Power BI reports help you spot trends faster and look at changes in the market, thanks to a time-based overview. At present, data visualization software is great for companies to form strategic decisions. And, get their teams ready for any scenario. In this article, we share our insights of a specific visual in data visualization: Single Number Cards: how it is created in Microsoft Power BI and what it is made for.
What are Single Number Cards in Power BI?
In data visualization, Single Number Cards are visuals that show a single amount in a minimalist way. Single Number Cards take a dedicated space in your business report and are often made for a particular set of data that you find relevant to the decision-making processes. From a design point of view, they are made as square-shaped boxes. In them, people find the ‘amount’ from data, and a label to understand what it means.
Single Number Cards are a great option for making quick statements in your business reports because they are straight to the point. These visuals are also easy to create. So, this makes them the most suitable option when you have little to no time to formulate a report.
When are Single Number Cards important?
Single Number Cards are the top choice when it comes to guiding everyone’s attention to specific data.
But when exactly do they become important to your business?
Whenever a business has to make decisions as quickly as possible. Also, whenever there’s a new opportunity that needs to be grasped. When there is a sudden, new trend in the market too: single number cards are your go-to data visualization.
In these scenarios, we need to focus on key elements of our supply chain. We might have to take into consideration our current production level or how much stock we have available. For all of these exact results, we use Single Number Cards. This way, we can avoid taking longer routes of data visualization and go straight to what our company needs to think about. Then, after all, this is said and implemented, making accurate changes will be easier for everybody.
What are the main features of Single Number Cards in Power BI?
If we were to create a Power BI Single Number Card, the points mentioned below would be some of its characteristics or features:
| Feature | Description |
| Data Label | This is the numeric value of our card; it represents the total amount of our selected data. For example, if we are making a card for our total stock available, it will show 80 units. In this example, ’80 units’ is our Data Label |
| Category Label | This is the ‘name’ that we use in our Data Label. It is basically the name of our selected category. Following the same example, our data label would be something like ‘Total Stock Available’. |
| Title | This is the name of our entire card; we use it to identify what our entire data is about. In this same example, we could name it ‘Production Performance’. |

Uses of Single Number Cards in Power BI
As simple as they look, Power BI Single Number Cards have many great uses. Some of these common uses are:
Tracking a total
As we mentioned before, one way people use Single Number Cards is for totals. Sometimes, we only need the final amount of a particular trend or product. This, without going in-depth at that moment. For example, we can use Single Number Cards for the total number of stores open globally by your company.
Highlight performance
Single Number Cards are excellent for guiding everyone’s attention to specific results. When it comes to performance, we can use them to focus on how much our quality has improved over the years, for example. We can also use them to show our current values by the time we make our business reports.
Prove progress
With the ability to go right to the top results, Single Number Cards are an absolute favorite to prove progress in business reports. You can share where your organization is according to your goals and needs. For example, we use one to learn our current total earnings. Then, we compare it to the number of expected earnings for the year.
Some Helpful Tips While Using Single Number Cards:
Let’s move on to sharing some of the best suggestions that professionals make, for adding Single Number Cards into our business reports. You can even take into consideration some of these for other types of data visualization projects:
Highlight Valuable Data
In some situations, too much information might distract people. This could make the decision-making process longer than necessary. So, while planning your business reports, it is best to focus on what your team needs to know right now, rather than the future.
Provide Context
Always make sure you explain what your data is about. This means that it is very important to set the context of what the motive for your report is. You can do this easily by using the features Category Label and the Title of your Single Number Card, as we explained before in this article.
Identify Your Audience
Similar to the latter tips, this one is about your company. Is your report for a specific department on your supply chain, or is it for members within a particular job role? Take into consideration what the people who are reading your report work for/in/with.
Encode Quantitative Data
Lengthy numbers/digits can be a bit difficult to read sometimes. This could also make the entire process longer than expected, and overall complicated. Think about encoding the numbers you display in your Single Number Cards. For example, portraying them as $75.54M or 7.54K would be a good start.
How to Create Single Number Cards in Power BI Tutorial?
Using Microsoft Power BI makes the whole data visualization process way easier.
It has already pre-established a wide variety of visuals for you to choose from.
In this quick guide, we will talk about how to create a Single Number Card in Power BI:
Select the Card Type
First, select the Card type from the visuals section in Power BI. It should create an empty card
Dimension DataThen, we are going to drag a dimension data into the Fields section |
 |
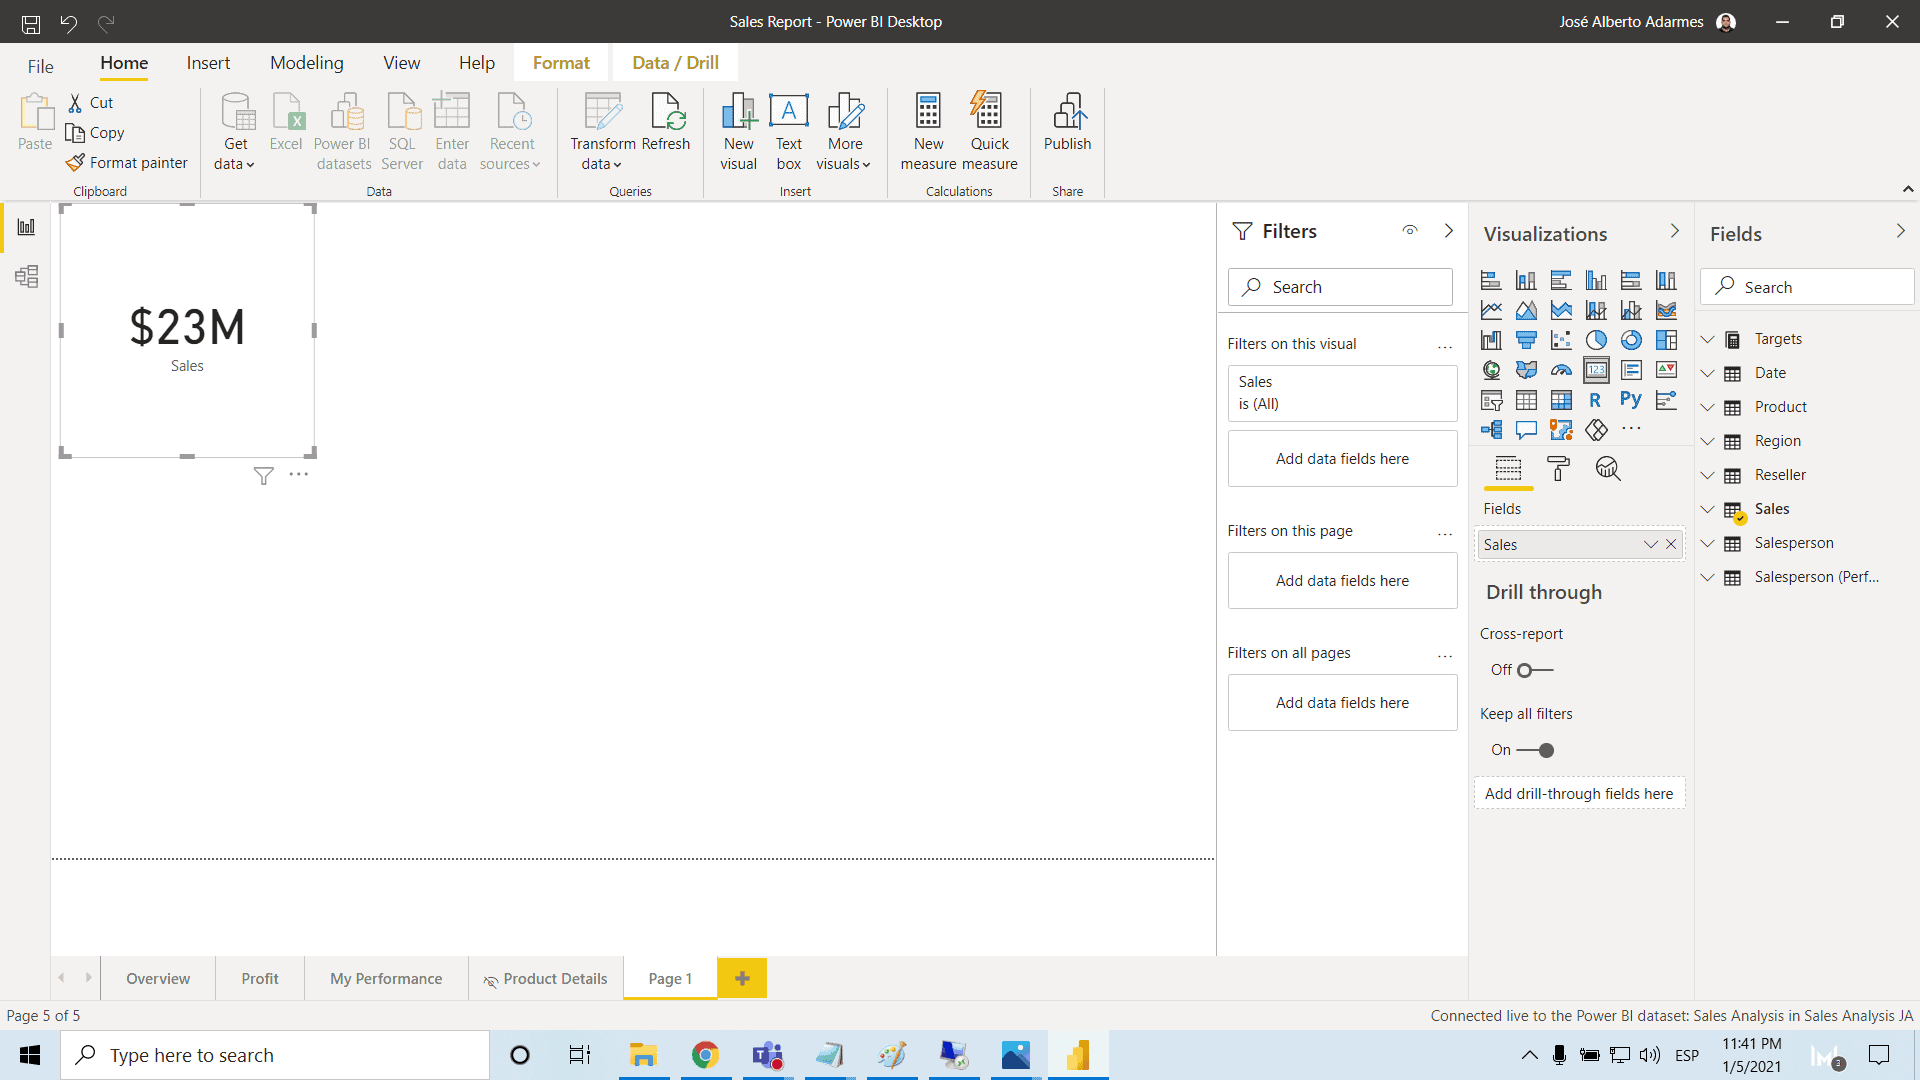 |
Choose Available FieldsWe are going to select what we want to show. This, by choosing any of the fields available in the Fields section |
Change Aggregated Functions
Finally, you can change aggregated functions according to your company’s requirements. After this, we move on to formatting our Single Number Card in Power BI.
Here is what you should be doing:
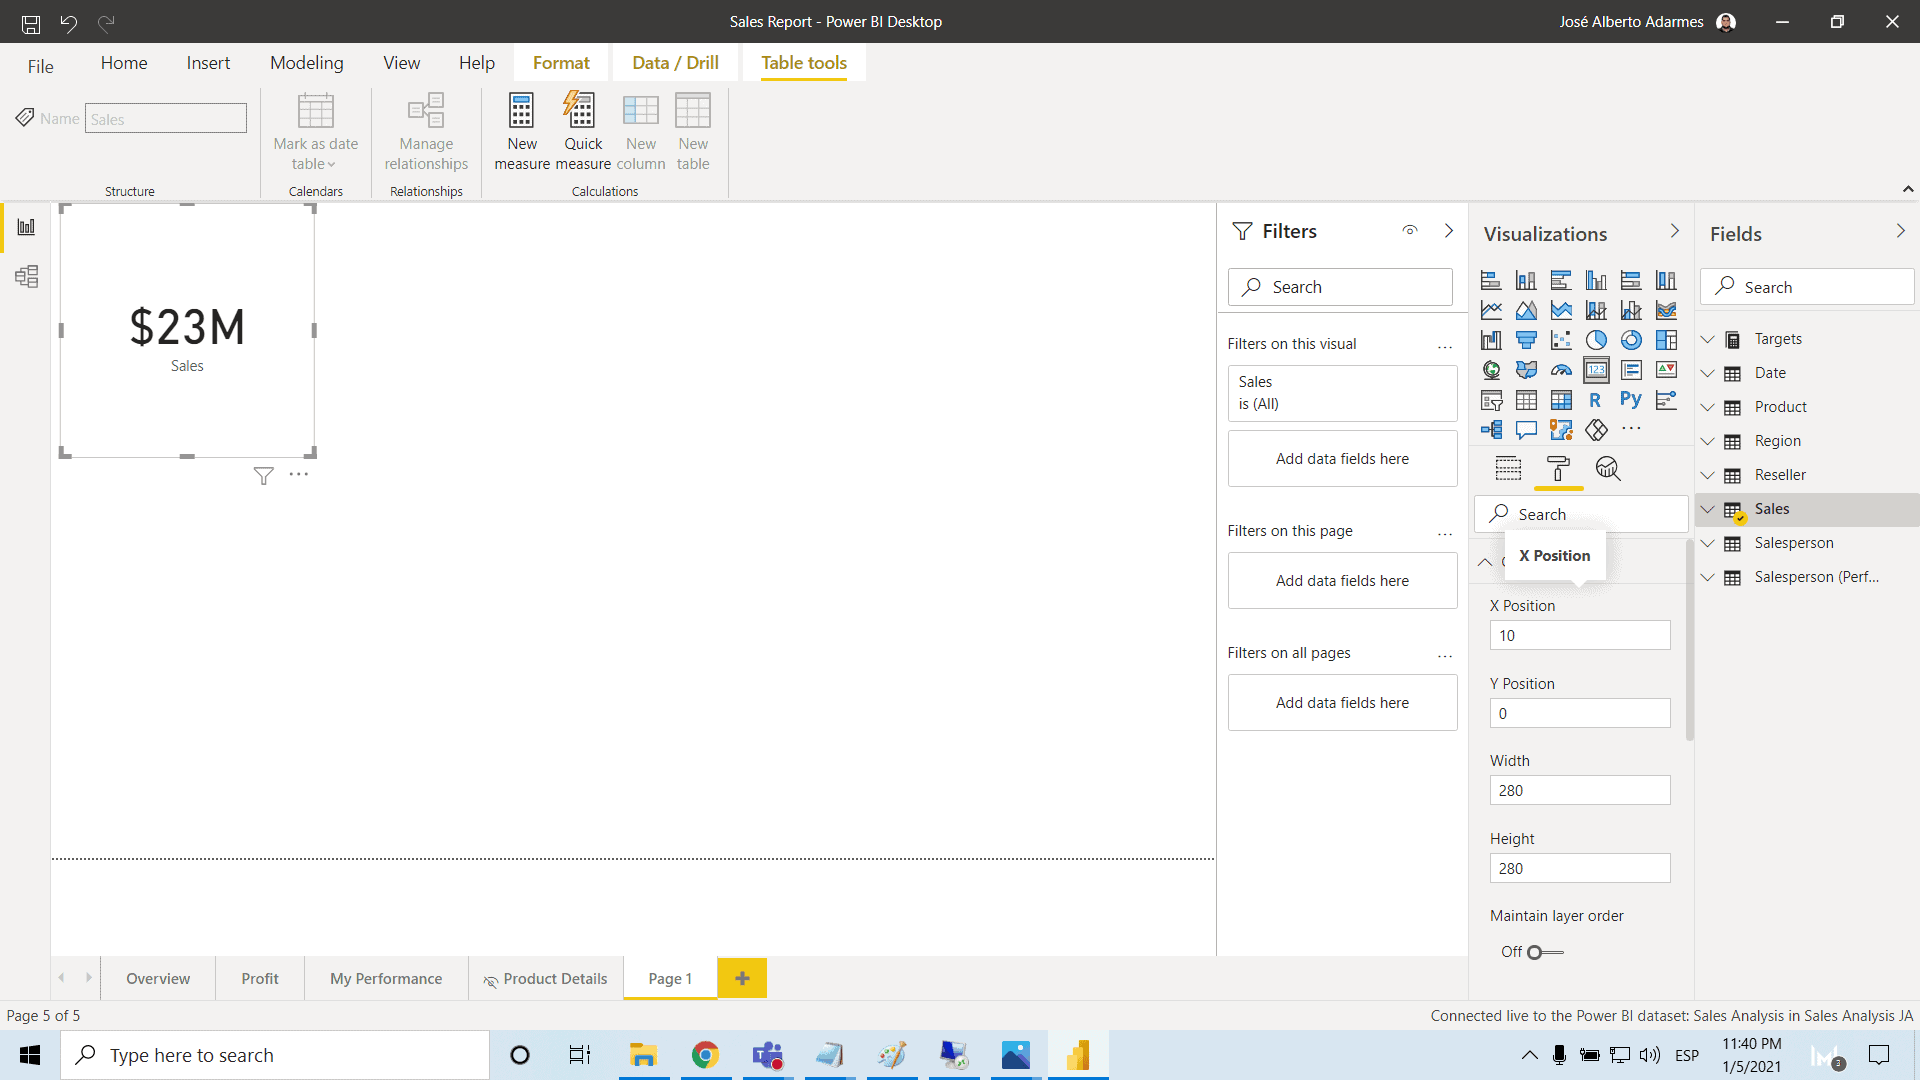
- Step One: Go to the Format button to see all the options you have. Here, we go over format features like Data Label, Category Label, Word Wrap, Title, Background, Lock Aspect, Border, and some General features.
- Step Two: Format the main features of Single Number Cards, like Data Label, Category, and Title of our Card. Here we can change things like color, text size, font family, and more.
- Step Three: Then, we can format design features like background or borders. You have to toggle these on to begin with. After that, you can choose color and transparency for the background, and color for borders.
- Step Four: Finally, in the General section, we can change things like X and Y position, width, height and alt text.

What are the Pros and Cons of Single Number Cards?
Pros:
- Great to highlight specific and highly important data
- Quick and easy to understand
- The minimalistic design and easy to create
- Works hand-in-hand to add value together with other visuals
- Valid and beneficial option when people have little to no time to create reports
- Great to keep reports low on resource-consuming features
Cons:
- Does not have the option to compare multiple data in a single graph
- Does not have the option to add layers of depth to your data
Last Considerations
Ideal Job Role
A Microsoft Certified Data Analyst would be the ideal job role here. This, because a Data Analyst is somebody who maximizes the value of a business’ data, using Power BI. Besides what we already mentioned before, Data Analysts also organize and transform information. They do this using advanced analytic capabilities through data visualization.
DA-100 Exam: Analyzing Data with Microsoft Power BI
The DA-100 Exam is one of the prerequisites for the Microsoft Data Analyst Associate Certification.
It focuses on analyzing data with Microsoft Power BI; and here, we are going to give you a quick overview of the subjects it evaluates:
- Preparing Data: From getting data through different sources to cleaning, transforming, and loading it. Also, this section covers profiling data
- Modeling Data: This one is about designing and developing a data model. It also includes creating measures using DAX and optimizing model performance
- Visualizing Data: This section evaluates people creating reports, and dashboards. Also, it evaluates how to enrich reports for usability
- Analyzing Data: Here, you learn how to enhance reports to expose insights and perform advanced analysis
- Deploying and Maintaining Deliverables: This section goes over managing datasets and creating workspaces
Microsoft Power BI Training on Single Number Cards
Let us now go over Microsoft Power BI and Single Number Cards. As we mentioned earlier, Power BI is a tool solely focused on Data Visualization. Also, due to its functionality, we are able to represent our information in interactive ways.
Where Do You Get Microsoft Power BI Training?
Microsoft has a lot of useful and free resources for your learning.
For this purpose, you can take a look at their guide on how to build a Single Number Card in Power BI. If you wish to take it one step further, you could also look for Instructor-led training. This is where you invest in getting a guided-learning experience.
The main benefit you get out of this investment is the knowledge and experience shared by your instructor. Also, with the added role of quizzes and assessment modules to help you at every turn. As a result; not only surface-level information but an enhanced curriculum is shared. Then, results in an overall better learning experience. Most of the time, technical support is also provided through a guided learning experience.
SUMMARY: Using Single Number Cards in Microsoft Power BI
In this part of our series, we have discussed the Usage and Analysis of Single Number Cards. Our suggestions will help your business in creating reports. Also, predicting the best practices suitable for your organization’s needs. Single Number Cards are a quick solution to highlight and portray vital information in a business report.
CONCLUSION: Microsoft Power BI – The Best Practices for using Single Number Cards
Microsoft Power BI training is a requirement in the modern business world. Data analysis and data visualization have a great role to play in your company’s decision-making processes.
We hope you enjoyed part 7 of our exciting Power BI Series. Our primary goal is and will always be providing you with high-quality content that is applicable to real-life scenarios. If you want to learn more about this topic or the courses we have to offer, you can do so by reaching out to us here. – Brandon Ahmad, founder of Instructor Brandon and Dynatuners.
We thank you for reading this article, and as always, you are welcome to leave us a comment in the section below.

