Consulting, Dynamics AX Performance
Case of the Poor Performance in the Financials Causing Late Night Work
 9103
9103 
Mar
Disclaimer: the methods/scripts here aren’t in any books or blog posts(until now) and come straight from my experience of having a lot of AX Performance battles. Please understand that these methods are not officially supported by Microsoft. They’ve just helped me get through 40 implementations successfully…. I’ll tell you right now. No matter how big and bad the performance problems are on an implementation, 95% of them can be classified in one of 10 patterns — often easy to fix once you learn to recognize them. I’ve yet to see an exception to this in over 40 different implementations, often with companies demonstrating very complicated Performance problems and months of frustration with trying out numerous fixes and fixers. Let’s go through a case here that demonstrates how to solve one of the patterns where our financial stakeholder/users were experiencing some serious pain.
Case Study: Slow Performance Causing People to suffer through Ridiculously long, late Hours to Get Through Invoicing
Throughout the month things were mostly okay, but when the end of the month came, the system slowed down a lot. Occasionally, it was slow during other parts of the month, but no one, including the DBA, could find anything that correlated with the slowness, except that the incidence increased with frequency at the end of the month. The problem was so bad that it wasn’t unheard of for our financial users to stay up till 11PM waiting on the system to finish the important activities for the business. What was the cause of this inconsistent behavior?
The Description Gives a Strong Hint as to what is causing this, but what should you ask Next?
Always ask one very important question when users tell you that the system runs fast sometimes but slow at other times.
Question 1: Does the same form with the exact same settings or the same report also differ widely in time or is usually with different inputs (use the word “inputs” instead of “Parameters” with non-technical users)?
Answer: And sure enough, the behavior was inconsistent. The users told me that they could run the same report or form during different times. Sometimes, things were fast. Other times they were slow. This was an extremely important hint but I needed to verify one other thing before designing the next test.
Question 2: this was directed at the DBA. Can you provide me with a locking graph showing any unusual locks in SQL and the frequency of those locks? Can I also see IO times while those queries ran and your thresholds for alerts? Reviewing the SQL counters, I was looking for things that went outside of the thresholds with hardware. There were none – increased volume but nothing that stood out pertaining to AX. Another important hint is that the SQL was not hardware stressed. Likewise, I also reviewed the metrics on the AOS servers and found no problems. I looked for common causes. This was fast because the client had the standard out of the box performance tuning setup. I was grateful.
My Suspicion at this point based upon what I call the 3rd Most Common Pattern of Performance Degradation – the User behavior Performance Degradation Pattern:
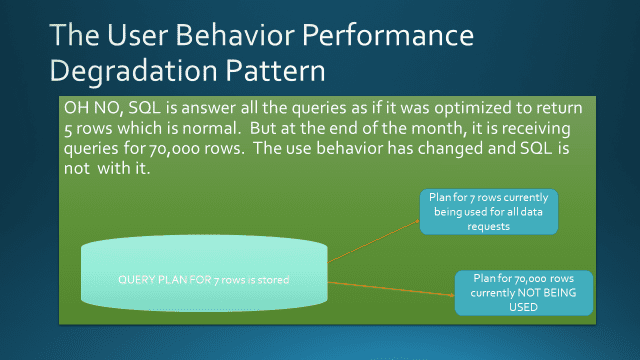
I call it the pattern of “User Behavior Performance Degradation”. See here is what happens. SQL creates query plans to optimize data retrieval. For those of you new to the term, query plans are the plan of attack for delivering data that has been requested. Now, what SQL will often do is cache a query plan once it has been presented to it for reuse. This saves time because SQL doesn’t have to formulate a new “plan of attack” each time a request comes in. But here is the issue. Sometimes, the plan of attack is based on the wrong thing. For example, company A might have a 70,000 rows for demoCustomer and company B might have 5 rows for demoCustomer. If SQL caches the plan for 5 rows and uses it for company A, performance will probably degrade a lot.
If you are a developer wishing to learn more then it may be wise to check out our Boot Camp, which takes you from zero to hero with some serious hands-on lab action.

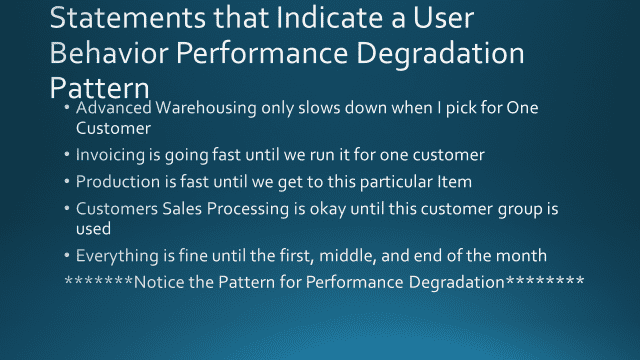
Now, very carefully read the slide and notice what all these things have in common?
- Only Runs slow when using one or two customers
- Only Runs slow when using a particular company
- Only runs slow at certain times of the month, etc..
What has most likely happened is that SQL is caching and using Query Plans that do not match with the current user behavior. This query plan may work just fine for 99% of the use cases.
But when it encounters those extra rows or that customer or vendor or item that is remarkably different than everything else in data requirements, things get really bad.
Thankfully, the User Behavior Degradation Pattern is one of the Easiest things to fix. In fact, it is so easy that I usually spend 2 hours training people on it and then offload it. It’s an essential skill to keep a database healthy.
Now, the first step that we will do is prove it out.
For that we need a logging table. We need to be able to capture the query plans and the parameters at different times. I usually run the script 4 times a day for two weeks.
I need good and bad times, so if the problem only happens at some point in time like the end of the month, I run it at that time.
Let’s review what the script does.
It creates a logging table and inserts the query cache in it or it simply inserts the new data in it if it already exists. You simply need to put the name of the AX database where it tells you to one time to run it. Now, continuing, I want to tell you WHY I did the things that I did in this script.
- Milliseconds I convert the average time to milliseconds because I’ve found that SQL queries executing below 15 milliseconds are usually meaningless in terms of causing bad performance. It’s another of the 10 patterns at that point that is the cause.
- Average Times vs Maximum Time I’m big on average times versus Maximum times. Average times for a query plan and text are important because they give you what to expect. Maximum times are important to see if the same query plan ever has trouble – this is particularly important for indicating hidden locking times, index fragmentation, or hardware failure. We’ll also use this to detect differences in the next post.
- The Sql statement is always selected. You will use this later to see if the same SQL statement ever differs on Parameter plans
- The Parameters are also important I will show you how to get these quite easily in my next blog post. You should specifically see if the inputs are wrong when you get the bad behavior and if there are better inputs
- The Time in Cache is very important You need to now how long that no longer useful query is staying in cache. As I said, it may be completely useful during certain times. It’s the other times that get implementations in performance trouble. When I blog again, I’ll show you a query plan that stayed in the cache for 3 weeks. You can only imagine what happened at the end of the month when those heavy queries started rolling in with that bad plan.
- Finally, notice how I bring in the Query Cache. This is the final secret towards easily beating this process. It allows for us to compare and contrast the same queries with different parameters quite easily.
So, before I call it a night on Part 1 and get some sleep, the first script you will need is below.
–Records QueryPlans in a table. Records must be exported out of the Staging Table to
–another environment
–Average Times are in Milliseconds
–Remember to put the Dynamics Database in for the Data Capture
–much lower impact on system than DynaPerf and easily ran from a job
Declare @databasename nvarchar(30);
Set @databasename = ‘Brandon_nonModelDatabase’; — Put your Databasename Here
if exists (select 1 from sys.objects where object_id = object_id(‘Brandon_QueryExecutionStats’))
Begin
insert into Brandon_QueryExecutionStats
SELECT
dm_exec_sql_text.text AS TSQL_Text,
CAST(CAST(dm_exec_query_stats.total_elapsed_time AS DECIMAL)/CAST(dm_exec_query_stats.execution_count AS DECIMAL) AS INT) * .001 as ‘elapsed_time_per_execution’,
CAST(CAST(dm_exec_query_stats.total_logical_reads AS DECIMAL)/CAST(dm_exec_query_stats.execution_count AS DECIMAL) AS INT) as logical_reads_per_execution,
datediff(mi, dm_exec_query_stats.creation_time, getDate()) as ‘Time in Cache(min)’,
dm_exec_query_stats.execution_count,
(dm_exec_query_stats.max_elapsed_time * .001) as ‘Maximum Elapsed Time’,
dm_exec_query_stats.total_logical_reads,
dm_exec_query_stats.max_logical_reads,
dm_exec_query_plan.query_plan,
GetDate() as ‘Capture Time’,
dm_exec_query_stats.query_hash,
dm_exec_query_stats.query_plan_hash
FROM sys.dm_exec_query_stats
CROSS APPLY sys.dm_exec_sql_text(dm_exec_query_stats.plan_handle)
CROSS APPLY sys.dm_exec_query_plan(dm_exec_query_stats.plan_handle)
INNER JOIN sys.databases
ON dm_exec_sql_text.dbid = databases.database_id
INNER JOIN sys.dm_exec_cached_plans
ON dm_exec_cached_plans.plan_handle = dm_exec_query_stats.plan_handle
where databases.name = @databasename
and CAST(CAST(dm_exec_query_stats.total_elapsed_time AS DECIMAL)/CAST(dm_exec_query_stats.execution_count AS DECIMAL) AS INT) > 0
order by elapsed_time_per_execution desc
End
/*
Run Periodic inserts at your convenience. You should Schedule this script in a SQL Job
or just run it against the Dynamics Database yourself ***Brandon Ahmad***
*/
Else
SELECT
dm_exec_sql_text.text AS TSQL_Text,
CAST(CAST(dm_exec_query_stats.total_elapsed_time AS DECIMAL)/CAST(dm_exec_query_stats.execution_count AS DECIMAL) AS INT) * .001 as ‘elapsed_time_per_execution’,
CAST(CAST(dm_exec_query_stats.total_logical_reads AS DECIMAL)/CAST(dm_exec_query_stats.execution_count AS DECIMAL) AS INT) as logical_reads_per_execution,
datediff(mi, dm_exec_query_stats.creation_time, getDate()) as ‘Time in Cache(min)’,
dm_exec_query_stats.execution_count,
(dm_exec_query_stats.max_elapsed_time * .001) as ‘Maximum Elapsed Time’,
dm_exec_query_stats.total_logical_reads,
dm_exec_query_stats.max_logical_reads,
dm_exec_query_plan.query_plan,
GetDate() as ‘Capture Time’,
dm_exec_query_stats.query_hash,
dm_exec_query_stats.query_plan_hash
INTO Brandon_QueryExecutionStats
FROM sys.dm_exec_query_stats
CROSS APPLY sys.dm_exec_sql_text(dm_exec_query_stats.plan_handle)
CROSS APPLY sys.dm_exec_query_plan(dm_exec_query_stats.plan_handle)
INNER JOIN sys.databases
ON dm_exec_sql_text.dbid = databases.database_id
INNER JOIN sys.dm_exec_cached_plans
ON dm_exec_cached_plans.plan_handle = dm_exec_query_stats.plan_handle
where databases.name = @databasename
and CAST(CAST(dm_exec_query_stats.total_elapsed_time AS DECIMAL)/CAST(dm_exec_query_stats.execution_count AS DECIMAL) AS INT) > 0
order by elapsed_time_per_execution desc
[/code]
What you should notice is just how easy it is to setup logging. Some of you might note that DynaPerf has similar logging but with a lot more overhead. Unfortunately, for as good as it is, DynaPerf, like many other SQL monitors, can be a cause of Performance Problems on it’s own, but that is another story. This is just a simple script getting what you need and dumping it to a table. You can create it as a job following a Wizard and copying and pasting it. Alright, getting ready to get some sleep.. But on Part 2, we will take our logging table that we created here and show a quick, reproducible process for applying some quick healing to the User Degradation Performance Problem and getting things back to running.

