Consulting, Dynamics AX Performance
Case of Poor Performance in the Financials Causing Late Night Work Part 2
 9072
9072 
Mar
Now, we will learn a very powerful and undocumented approach towards tuning Dynamics Operations Performance in this post. In part 1, we started out by looking at a painful case of people having to work ridiculously long hours because the system was slow at certain times. We learned that this seemingly random behavior could be identified and diagnosed quite easily. I then gave this sort of behavior a classification where I said that changes in User Behavior for Dynamics AX/Operations can often fool our database and result in slow downs . We then learned one way (there are quite a few) to setup initial monitoring for this condition. Now, we will go through the process of actually fixing the data.
This ain’t the Philadelphia 76ers but Performance Tuning is all about “the Process”
Whether I’m on a little assignment with one performance issue causing all the drama or a major one that requires 6 months of work to get the system performing in a viable way that meets business needs, I always follow my process. I don’t care how many people have attempted and failed at Performance Tuning an implementation before I got there. Watch how we do it here.
Step 1: Find the Queries that are actually using Multiple Different Plans
We have a hero here. The Query Hash. What it does is group similar queries despite differences in parameters. While not perfect, it is powerful because it gives us a powerful way to determine when queries are the same and compare time differences, load, and stuff like that. Likewise, the query_plan_hash allows us to group different queries.
So what do we do? We differentiate them of course. For this particular issue, we need to look at duplicates. Lots of other things can be seen from the monitoring table that you built, but here, we need to see how the behavior of those queries is varying. The query below detects parameter sniffing right in it’s tracks because you can see the query, the plan, and the times and load for each time as well as the execution count.
[code language=”sql”] with multipleQueryPlansAS
(
select QueryStats.query_hash
from
(
Select distinct query_hash, query_plan_hash
from Brandon_QueryExecutionStats
)
AS Querystats
group by query_hash
having count(query_hash) > 1
)
Select * from Brandon_QueryExecutionStats
where query_hash in (select query_hash from multipleQueryPlans)
order by query_hash, [Maximum Elapsed Time] [/code]
For example, using Nonconfidential information/Demo bait for my public blog, we can see how this theoretical customer’s security loading of roles time ranged from half a millisecond to 6 milliseconds depending on the query time. That’s a difference of nearly 12 times the performance though we wouldn’t care about 6 milliseconds usually. (Side Note: not covered here but on the security performance problematic performance pattern, the extremes will be far worse than this). This is a good example because it’s generic enough to not divulge any confidential information so let’s pretend that 6 milliseconds is actually 6 seconds and half a millisecond is actually half a second.
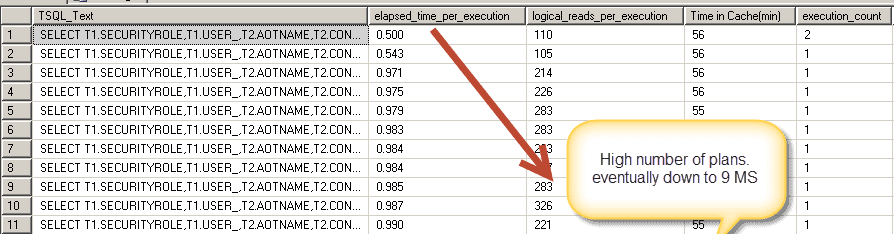
Ooooouch.. Something is wrong. SQL is varying those plans way too much. And why does SQL need to even generate a new plan for each query in the first place.
Step 2: Identify the Differences in the Plans
The easiest culprit that can help you identify why two plans are different is to look at the inputs that went into the SQL statement. To get the parameters, either click on viewing the plan as xml and find the “parameter list”
Or run this query :
SELECT Top 1000 TQE.*,
nos.query(‘//ParameterList’) as ‘Clickable Parameter List’,
cast(nos.query(‘//ParameterList’) as nvarchar(max)) ‘Copy and Paste Parameterlist’
FROM Brandon_QueryExecutionStats TQE
OUTER APPLY query_plan.nodes(‘//ParameterList/*’) (nos)
where query_hash = (paste your query hash here)
order by [Maximum Elapsed Time] desc
[/code]
Or perhaps we need a more aggregate view.
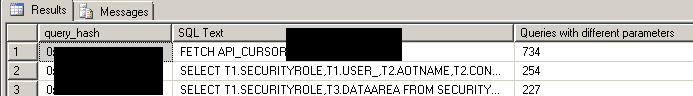
[code language=”sql”] Select top 100 query_hash ,max(TSQL_text) as ‘SQL Text’, Count(*) as ‘Queries with different parameters’from Brandon_QueryExecutionStats
group by query_hash
order by ‘Queries with different parameters’ desc
[/code]
Here is another example:
Notice here how the code sync from the model store is taking higher time than usual – often noticed when users are having a caching performance problem.

But let’s go further. I click the XML next to see the parameters. I’m very interested in what is causing the slow code loads for the client.
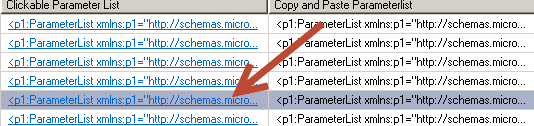
After clicking the list on the XML list, I get the parameters for one of the slow queries.
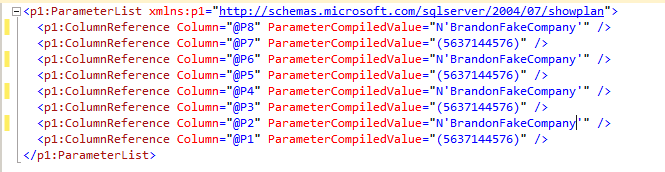
What you want to do is compare plans and see which plans are fast and which queries are slow for the same query. Examine the plan carefully. Look for parameters that differ. Determine what the optimal plan is. Then test it against the other query plans that are generated.
PAUSE!!! What have you Learned So Far Towards Identifying the Slow Causes of Performance
- You learned how to setup logging to identify discrepant data behavior
- You learned how to diagnose and identify the pattern of queries showing different behavior
- You learned how to go further with the diagnosis and see the different parameters which directly account for the changes
- You learned how to see the parameters of the SQL queries which will usually identify the problematic application areas
Now, in the final step, let’s see how we would resolve this problem.
-
First Isolate the problematic query by running each query against the parameters and recording the times:
(Set your Variables here)
WHERE (((PARTITION=@P1) AND (DATAAREAID=@P2)) AND (((WORKERENROLLEDACCRUAL=@P3) AND (TRANSDATE>=@P4)) AND (TRANSDATE<=@P5)))
OPTION (OPTIMIZE FOR (@P2 = ‘Example2’), recompile)
[/code]
The key from above is this. First, you did trial runs with the main query that you copied and pasted from the TSQL text. You changed the select statement but the important part is the “Optimize for” and “recompile”.
It allows you to see how running a trial query against different parameters will yield different results across all the ranges of expected queries.
Do trial runs against each plan with syntax similar to above. Find the time that is most optimal on a SQL server that has the same version and patches. When you find the right version by finding a parameter setting than you make a plan guide which tells sql server how to generate the plans. You can enable and disable the plan guide. So say that you notice that when you tell SQL to run the query with the plan it used when the company is “Example2”, it goes 10 times faster than the plan it used for “Example1”. Put that in the plan guide.
Or for another example, here is a case where I made a client’s problematic payroll processing 10 times faster by varying the plan (leaving out the parameters for obvious reasons).
Once we determine the problematic query, run something like this:
@name = N’AccrualPlanGuide’,
@stmt = N’SELECT SUM(T1.ACCRUED), SUM(T1.CARRYOVER), SUM(T1.USED), SUM(T1.PENDINGUSAGE) FROM PAYROLLACCRUALTRANSACTIONSVIEW T1
WHERE (((PARTITION=@P1) AND (DATAAREAID=@P2)) AND (((WORKERENROLLEDACCRUAL=@P3) AND (TRANSDATE>=@P4)) AND (TRANSDATE<=@P5)))’,
@type = N’SQL’,
@module_or_batch = NULL,
@params = N’@P1 bigint, @P2 nvarchar(4), @P3 bigint, @P4 datetime, @P5 datetime’,
@hints = N’Option(Optimize for (@P1 = 5637144576, @P2 =”company”, @P3 =5637144576))’
[/code]
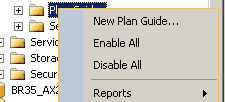
What is also nice is that we can disable and reenable the plan guides at our discretion. So maybe, we need things to run differently during most of the month, but during those last 2 days of the month, we need to change our plan. Or from the hours of 4 to 6 when users run trial balances or something else. That’s fine. We can right click within SQL server under the database..Programmability..Plan Guides and do all of that.
Finally, the Summary
This concludes our case of the users having to work long hours. I adjusted their plans and that fixed the issue. Study my approach hard if you are on an implementation with performance problems that especially express themselves at different times even when the same process is run. It’s usually this or something else that is running and interfering with the normal process. The approach can be varied depending on the circumstances also. There are monitoring tools that do something similar although I like my own custom approach. One note is to be careful of over monitoring. Capturing Query Plans is extremely performance heavy. You don’t want to be doing this all day in production or every 5 minutes. Use it when you need it or schedule it during optimal times.
And finally.. Enjoy the rest of the week. Performance tuning isn’t as bad as people often think once you know the key processes. Till Next time.

