Consulting, Dynamics AX Performance
Technique for Solving AX Crashes and Slow Startups when you can’t find anything in the logs
 13057
13057 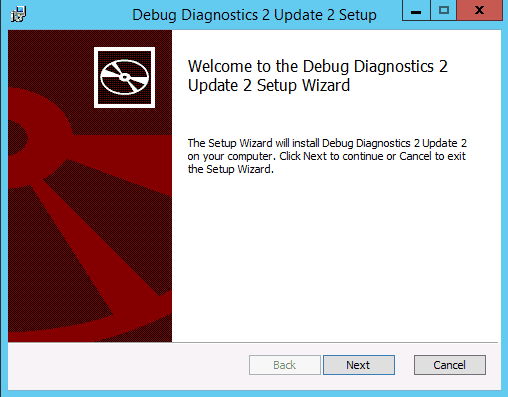
Dec
If you’ve read any of my blog posts, you’ve probably noticed that I’m a big fan of avoiding complexity by using simplified methods within tools to solve complicated problems – like when you can’t find information anywhere about what you are trying to solve. Here I’ll share one of my favorite techniques world for solving very complicated AX problems. One time, I solved a problem of a slow AX Client load in 30 minutes that had been looked at by Premier support plus 2 very good partners over a year with no resolution. See, there are times where you have to look under the hood – not deep under the hood, but under the hood or the error will nearly be impossible to find. DebugDiag 2.2 includes some enhanced features for making that happen as we will see here.
Case: Despite having super hardware, the client complained of AX taking forever to launch on initial startup. This time, it wasn’t the antivirus (most of the time it is the antivirus when the hardware and sql setup is right). Premier Support had looked at the issue and been unable to solve it. One Partner got fired and another partner was well on their way to also getting fired as the client was about to cancel AX. The client reported that startup times for forms had degraded significantly. They timed it. At first, it took 1 minute and 32 seconds to startup AX when the application was first installed. Over the course of a year, time degraded to well over 3 minutes and 54 seconds. Can you spot the pattern? SQL counters were fine. AX events did show degraded performance however over non-customized code, it seemed.
WHAT IN THE WORLD WAS IT?????????????????
Going underneath the hood, I found that 5 ISV’s had been installed. The client was looking for some of those ISV dll’s on startup but unable to find them on all the computers. This was leading to hanging on startup when it threw exceptions. Also, the client had left the default missing .dlls by Microsoft on startup. Finally, through SCOM, the client had a debugger running which was pausing the application when all these first chance exceptions loaded. Having a debugger run during a CIL with assembly errors is a good way to see things really slow down as I’ll explain later. It was a perfect storm – over time, the failure to properly deploy the assemblies to all the components caused performance to go straight “down the drain”.
SO HOW DO YOU DIAGNOSE A CASE OF HIDDEN EXCEPTIONS THAT DON’T SHOW UP IN THE EVENT LOGS???
1st: As always, we need the right tools. Both WinDbg and DebugDiag work excellent here. With the way that AX is going (like AX 7), debugdiag is the most recommended tool of choice for deep logging because of all the builtin features for IIS and httpcontext. Make sure that you get the latest updated version of it. Right now, that is version 2.2. It’s important that you don’t use version 1.1 with Server 2012(or greater) as it will miss plenty of events and does not contain the newer enhanced logging features that you’ll come to deeply enjoy.

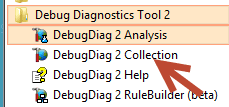
2nd, if using the new stuff, this is really easy to setup. After following the setup, open DebugDiag but choose a Collection type as we are about to setup a continuous monitoring process.
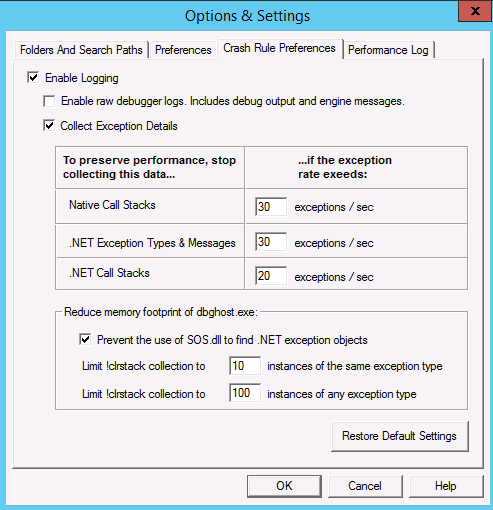
3rd, Here is the real cool part where you can just go to town, but the neat thing is that you often don’t have to do so. Just leave this alone but note it for now. You’ll need it later.
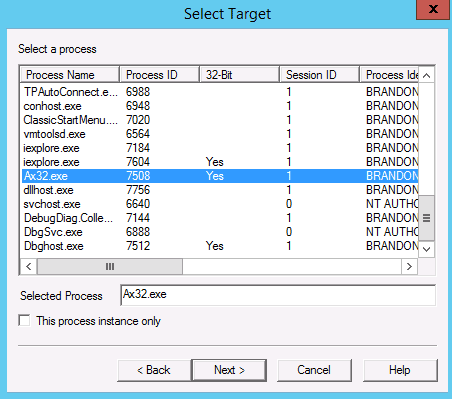
4th, Now, just add a rule and choose the axclient process. In this case, I choose the AX32 client because I wanted to see what was happening from the client side of things to correspond with server events.
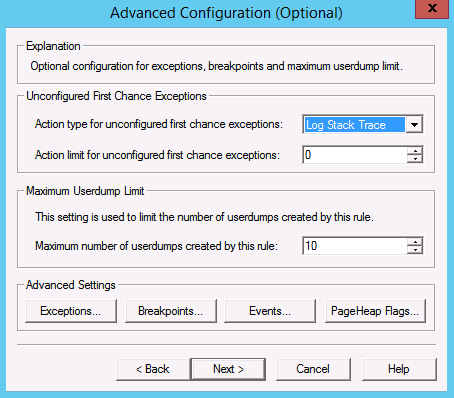
5th, on the action limit for first chance exceptions, you want to choose “stack trace”. This will give you more information if there is some known issue and what is the cause of it. Note, this should not be left on 100% of the time. Like all debuggers, an application will be impacted on performance – and the hit can be very severe. So, you usually only run them when you are investigating.
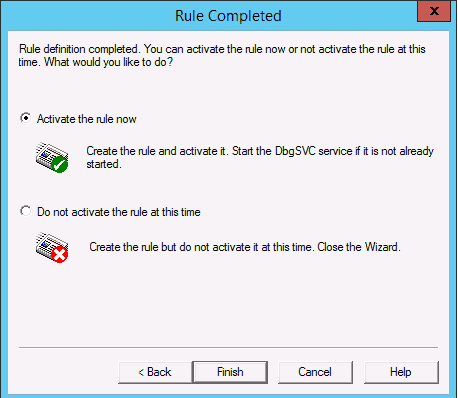
5th, Keep clicking “next” until you activate the rule. You can change the log location in the wizard screens along with the crash rule name if you like. Activate the rule and you are done. You can disable it at any time. Really nothing fancy here to get some seriously powerful logging. The key with good logging is to start general and tune it till you can pinpoint the area. The more specific, the easier it is to find the issue. Be sure to choose “yes” when it ask you if you want to choose the default symbol path.
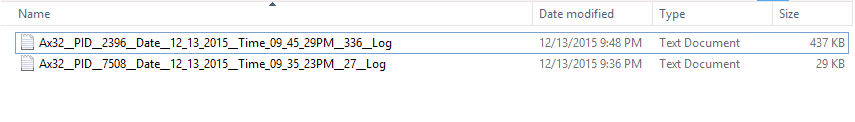
Now, this is where it gets extremely advantageous. Here I’m going to click on one of the log files shown below.
The log file shows a number of interesting things. Scrolling down to the bottom of the file, you can see a nice pretty summary of the errors and exceptions that were encountered. In this case, I purposely made the AOS open up slow in one of my gazillion test vm’s to induce errors. I’ve seen far worse live on Production environments for major corporations. There are some definite exceptions of interest here which are impacting performance. Let’s take a look at one of them.
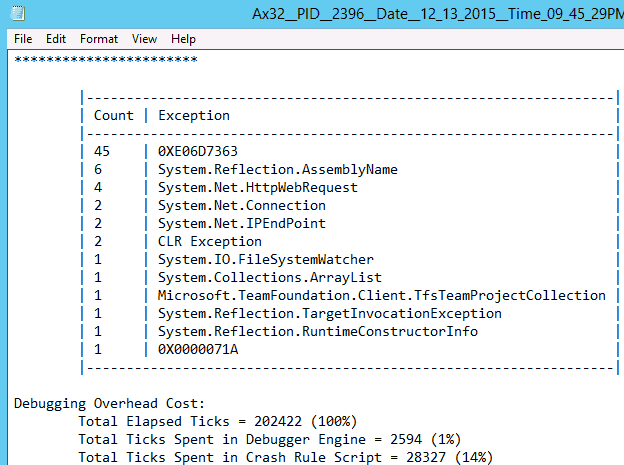
And here you can see a failed load for one of the retail components.
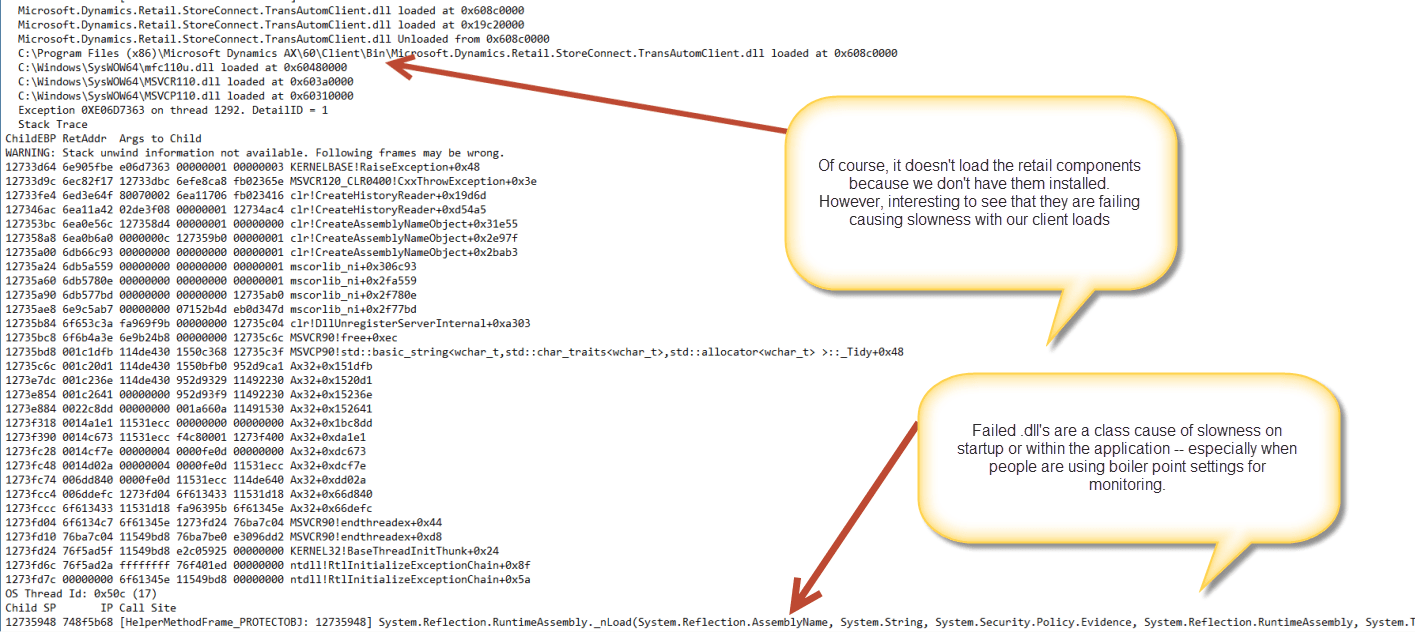
Consequently, as an FYI, when people have logging of first chance exceptions on and a debugger, failed .dll’s are a classic cause of slowness and crashing in AX. I’ve seen it many times with companies even ready to cancel AX over something as easily fixable as .dll’s. Even if someone isn’t using the retail .dll’s for example, all they have to do is copy the retail .dll’s from the Microsoft sample VM(if the kernels and updates match) to the folder where it is looking. It will at least stop the exceptions from being generated. Also, note, the debugger costs some overhead to log that exception. When a number of exceptions start happening, this can be a significant performance drain, so you have to remember to turn off the debugger. But this will save you time on diagnosing what would otherwise be very complicated problems. I’ve seen it go from taking minutes to fire up AX to seconds by taking care of the exceptions (especially with external .dlls that don’t deploy correctly by the default mechanisms like unsigned .dll’s tend to do) or with bunches of first chance exceptions. Exceptions tend to incur an expensive “throw” error when they are called so when you have a lot of them like in this case where there were over 60 of them, the application is going to start very slowly no matter what kind of hardware that you throw at it. .
So, what have we learned – Hell YES to the Empty Crash Rule Technique for Error diagnosis. Enjoy the week!!!!!

