Document and Fix Issues
In addition to identifying errors, you can use the debugger to better understand how the code manipulates variable values and the order in which certain processes are run. This can help you gain a better understanding of certain processes, like seeing what validations are made during item entry.
A breakpoint is represented as a red dot by the line number of the code. You can set as many breakpoints as needed, but excessive breakpoints can make debugging take a long time due to the code constantly starting and stopping. The debugger toolbar contains options where you can set breakpoints, remove breakpoints, and remove all breakpoints.
When the code comes to a break point, you can also select options in the debugger toolbar to Step Into the code line by line. Doing so will also go into any method calls in the code. You can Step Over to proceed to the next line without going into any method calls. You can also Step Out, which will run the current function to completion. With the Run button, you can continue running the implementation until completion or until the code comes to another breakpoint. The debugger tool also has a Stop tool to end the running code and exit the debugger mode.
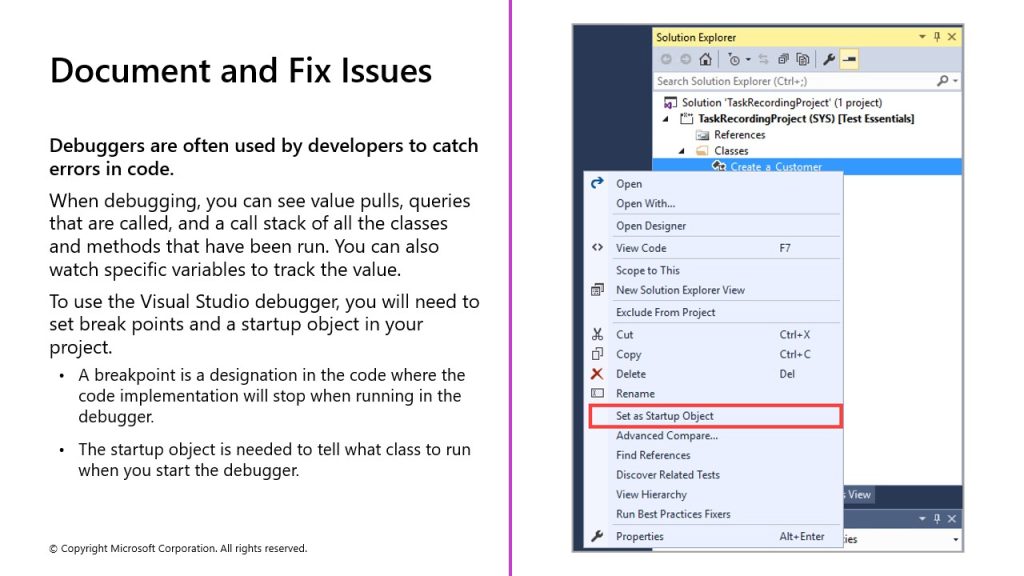
The startup object is needed to tell what class to run when you start the debugger. You can select the startup object by right-clicking an object in your project and then selecting Set as Startup Object. Usually, this is a form or class. When you decide to run the debugger for the object, from the Debug menu, select Start and a new window will open, running the startup object that you have selected.
