Diagnose Performance Issues by Using Trace Parser
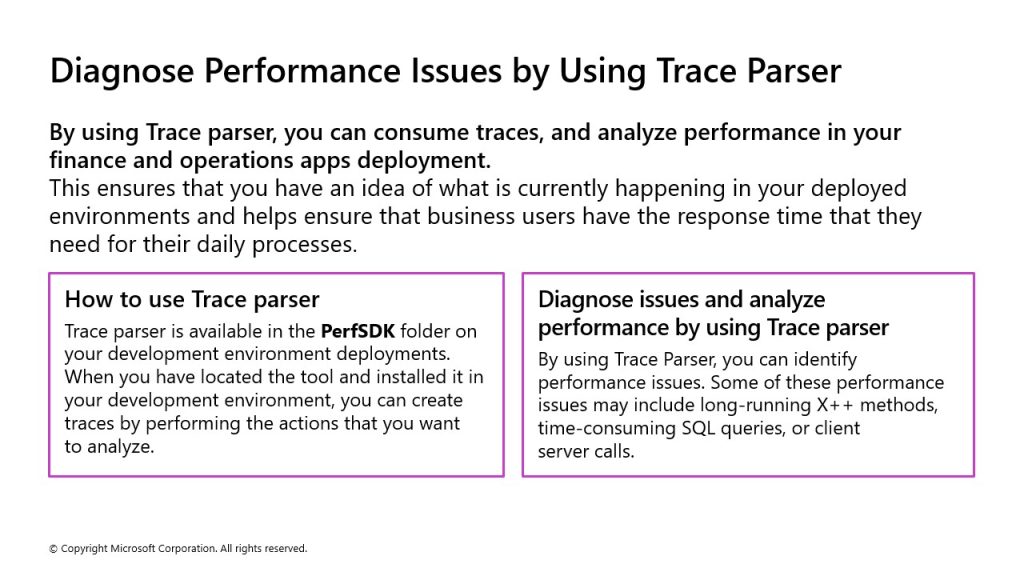
How to use Trace parser
To capture a trace, you must first ensure that you have completed the list of tasks that you need to analyze to avoid having metadata and other tasks included in your trace. You must also add the System tracing user role to the user who needs to complete the trace. In the finance and operations user interface, go to System administration > Users > Users. From there, you can select the user and select Assign roles on the User’s roles FastTab.
After you have added the System tracing user role, the assigned user can capture the trace. In the navigation bar at the top-right of the screen, select the question mark icon. In the drop-down menu that appears, select Trace. When the new screen appears, name the trace that you are going to capture and select Start trace. Perform all the actions that you need to capture and analyze before selecting Stop trace.
When you stop the trace, you can select Download trace, which will store the captured trace on your local machine, where you can analyze it with the desktop version of Trace parser; however, it cannot be uploaded later. If you choose Upload trace, Trace parser will store the trace in the cloud to download at a different time, but it will be automatically deleted after seven days. Alternatively, the trace can be manually deleted from the Captured traces page.
Tip:
If your sequence of events for a trace takes more than a few minutes, we recommend that you take multiple, smaller traces to minimize the risk of losing data if the trace becomes too large to analyze in a timely manner.
Diagnose issues and analyze performance by using Trace parser
The captured trace can be opened to diagnose issues and analyze performance of the tasks in multiple ways. The next step after downloading the trace file is to open the Trace parser on your developer environment or VHD. Trace parser is installed by default and is located in C:\Program Files (x86)\MicrosoftDynamicsAX\Microsoft.Dynamics.AX.Tracing.TraceParser.exe .
Note:
Trace parser is only available on DevTest topology deployed environments, it is not available in Demo topology environments.
In the Trace parser, you can download and import the previously captured events. To do this, select the Download and import button in the Trace parser to import the ETL file.
To view the traces and analyze them, select the Timeline tab to see the timeline view. You can use the Select Grouping drop-down menu to group content that is based on a variety of categories and event types, such as Customer ID, username, Session name, and so on. The groupings will display timestamps of each event, total number of events, and the lowest event level in the grouping.
