Create a SQL Trace by Using the SQL Profiler
Note:
This tool can only be used on tier 1 Dynamics 365 instances.
There are many reasons why you would want to use the SQL Profiler. For example, you may need to see all the long-running queries on the SQL server system, not just the long-running queries in finance and operations apps.
To access and use the SQL Profiler, follow these steps:
- In SQL Server Management Studio, open SQL Server Profiler from the Tools menu.
- Connect to the database.
- In the Trace Properties windows, name your trace.
- When you have specified all properties, select Run.
- While the SQL Profile trace is running, you perform the process or processes that are of concern. For example, users may be experiencing slowness when adding data to the SalesTable. In this case, you will ask the user to perform the task, while the trace is running.
- When the process is complete, stop the trace by selecting the Stop button in the menu.
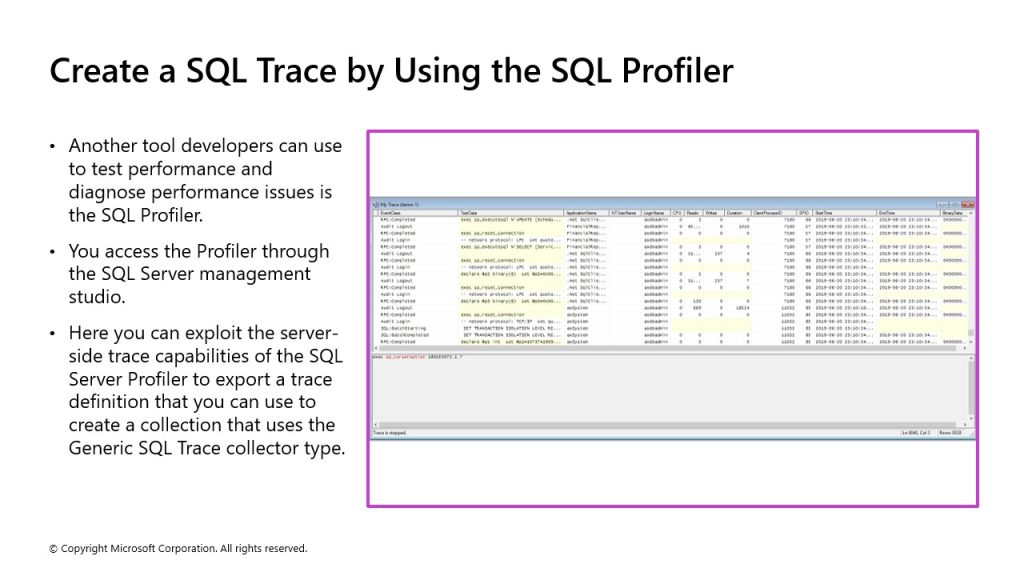
- Now you can analyze the trace by reviewing the trace results. The following screenshot shows what the trace looks like when it is stopped.
