Tag Archives: stacked area charts in power bi
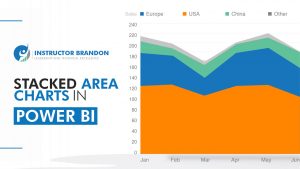
Power BI Data Visualization Best Practices Part 2 of 15: Stacked Area Charts
The Digital World & Business Intelligence In the midst of a digitally competitive era, making [...]
17
Dec
Dec


